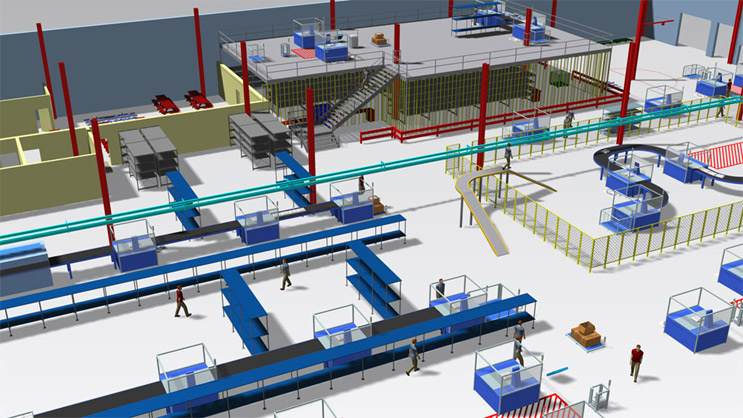
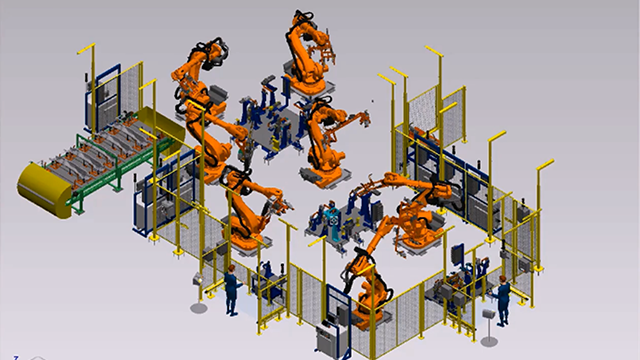
Simulation is a process of using a computer model that represents an existing or planned system to understand the various interactions and constraints in a production system. Simulation modeling allows proposed changes (what-if scenarios) to be tested, productivity, labor and equipment impact analysis of these changes to be performed and understand and visualize the effects of change and the resulting costs prior to implementation.
Production & assembly lines can be a simple or a complex process depending upon the products, the part routing, and facility layout. We put together a list of some commonly received questions for improving processes of all sizes:
Where are my constraints in the process and how to manage them?
How should I allocate my operators?
Where and how much buffer should be added?
Managing Constraints
Simulation can help identify maximum production line capacity. If the simulation predicted capacity is less than the target, a Throughput Improvement Road Map (TRIM) as shown in Figure 1 can be developed using Simulation studies to achieve the target capacity. The TRIM will identify the constraints (might be cycle time, station/equipment downtime, changeovers, etc.) that will have the most impact on the production. The Team can then and decide the best way to bust the constraints based on cost, ease of implementation, resources required, etc.
Figure 1 – Throughput Improvement Road Map (TRIM)
Managing Operators
Simulation can also be used to validate operator or resource allocations. Initially, line balancing technique can also be used to smooth out the production flow by allocating task to the operators such that the task can be completed within the allocated time. Line balancing data then can be fed into simulation for validating the output. What-if scenarios with different operator allocation or schemes can be run to see impact on throughput and overall operator utilization as shown in Figure 2, thus reducing overall cost.
Figure 2 – Operator Relocation Analysis
Managing Buffers
There is always a tendency to add more buffer to the production or assembly process. Adding buffer is not cheap, buffer not only increase inventory cost but also require additional capital to buy equipment to store and move the product. Example – A conveyor needs to be extended to accommodate more buffer, additional fixtures required to hold a product in a automated robotic process etc. Simulation can not only help identify location of the buffer but also quantity of buffer required. Buffer sensitivity analysis as shown in Figure 3, can be conducted to identify number of buffers required at a certain location.
Figure 3 – Buffer Sensitivity Analysis
As you can see Simulation can offer various insights in identifying the constraints, use of labor and identifying location and quantity of buffers, thus simulation can not only help increase production but also help in reducing the cost, thus increasing profits!
A major producer of baby-food products desired additional information about their existing bottling system and recommendations to improve production efficiency. To meet the client’s goals, PMC first simulated the existing design and then modeled several different scenarios to optimize system throughput.
SYSTEM DESCRIPTION
The bottling system consisted of the following: Glass Depalletizer, Optical Scanner, Accumulation Table, Filler, Capper, Coder, Tray Packer, Case Palletizer, Labelers and a system of conveyors.
OPPORTUNITY
A new bottling system’s design called for the linking of the best equipment and technology that the company had available. However, this linkage did not exist or might have been inefficient and being run over capacity.
APPROACH
The main objective of the study was to understand the behavior of existing bottling systems and to assist in designing new and efficient ones. This was achieved by:
• Identifying bottlenecks and determining the level of resources necessary to maintain production targets.
• Providing accurate, objective, quantitative information to refine the process and increase productivity.
• Developing a control strategy for the system by understanding its logical operation.
SOLUTION
First, a base model operating under original specifications and parameters was developed for evaluation. Then, alternative scenarios and suggested system improvements were modeled and evaluated to determine the line configuration that would optimize system throughput.
BENEFIT
The process simulation allowed engineers to test the system and identify inefficiencies. This study led to the most effective system configuration by quantifying the effect of changes to the system.
PMC helped a major automaker design the layout of a parts warehouse. Using simulation, researchers determined the staffing levels that different proposed layouts needed to achieve the facility’s targeted throughput.
SYSTEM DESCRIPTION
The proposed warehouse was to receive, store and distribute windshields and many parts associated with them. One group of resources, the “pickers,” were to traverse the warehouse picking parts out of inventory to fill purchase orders. Other resources, the “restockers,” were to continually replenish inventory. The physical layout of the plant was not yet determined; one proposal called for a two-tier system, with inventory arranged along seven aisles, while another prescribed a one-tier system and thirteen aisles.
OPPORTUNITY
Pickers and restockers were to work simultaneously, which raised issues of traffic flow, material flow and safety. Also, it was known that the warehouse would have to attain a high level of throughput, but the automaker wished to achieve this aim with a minimum of workers in order to limit labor costs. Given all these complications, the automaker needed to determine optimum warehouse configuration prior to construction, in order to prevent the future expense of high staff levels or overhaul of the physical layout.
APPROACH
The objective was to determine how many workers were required to safely and reliably produce a total throughput of 900,000 pieces per year for the one and two-tier proposed scenarios.
SOLUTION
Researchers began by collecting information on the specific dimensions of the proposed layouts. They also studied representative samples of parts orders, plans for storage of parts within the warehouse, and the decision algorithms and floor-scale motions that workers in the warehouse would need to make. After reviewing these findings with the client, PMC researchers built a series of simulation models.
BENEFIT
Results of simulation runs indicated that the one-tier scenario would yield the best performance, meeting the target of 900,000 pieces per year with only 13 pickers and 6 restockers.