
The Foremost Experts in Laser Scanning & Reality Capture:
Save time and reduce costs with unmatched precision.


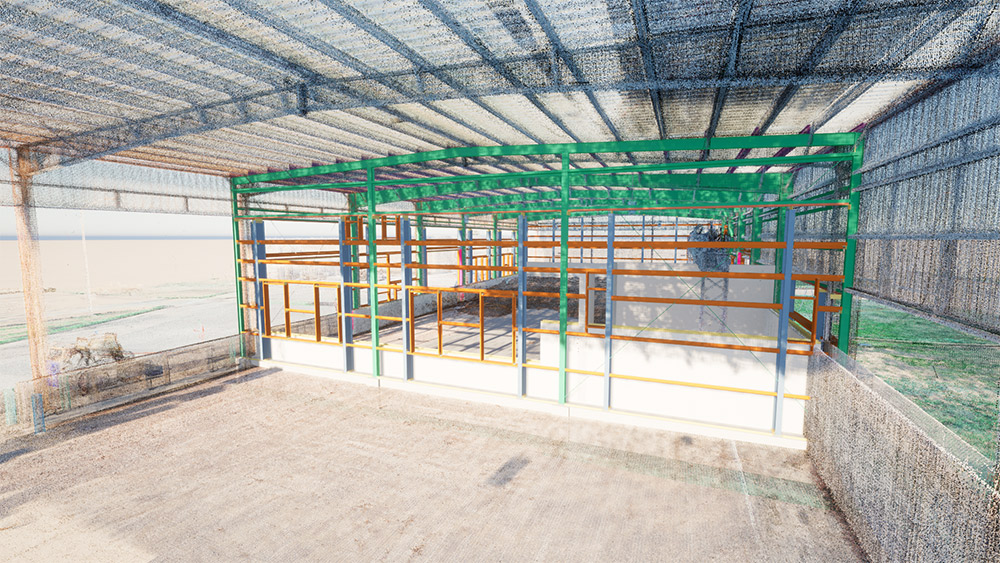
Digital Twin & Industry 4.0:
The most accurate representation of reality, providing the foundation for building data standards at your highest value.


Comprehensive Industrial Engineering and Operations Consulting Services to help your
organization’s productivity initiatives succeed.

Your Partner in Productivity Improvement
Years of Experience
Projects Completed
Happy Clients
PMC Expertise Areas
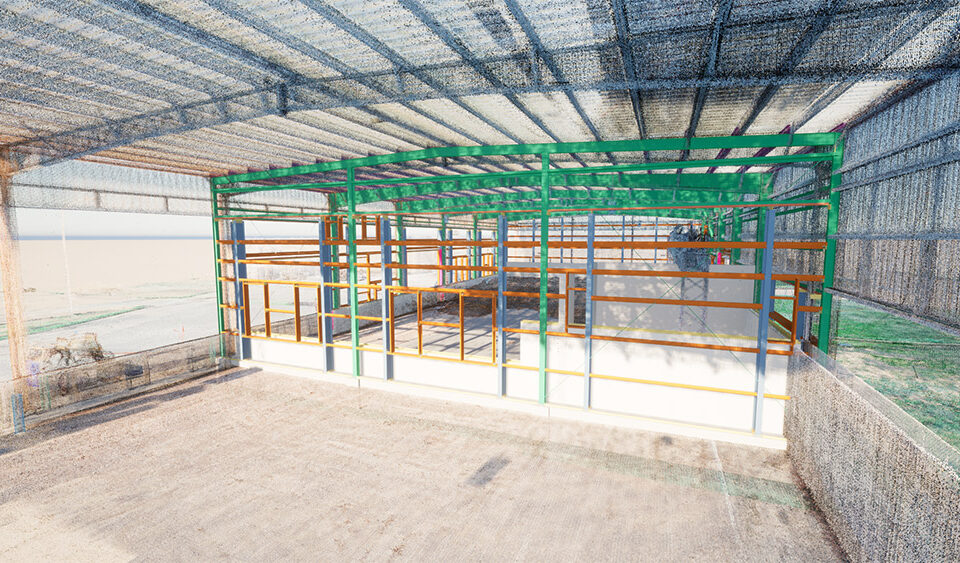
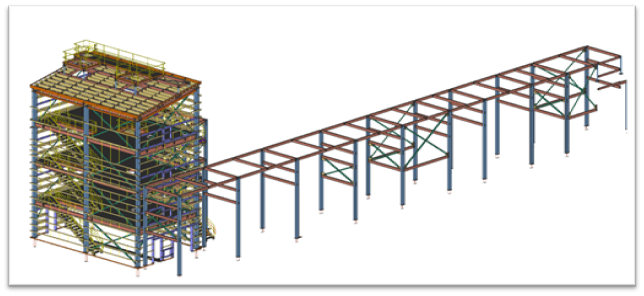
Laser Scanning & Digital Twins

Industrial Engineering Consulting
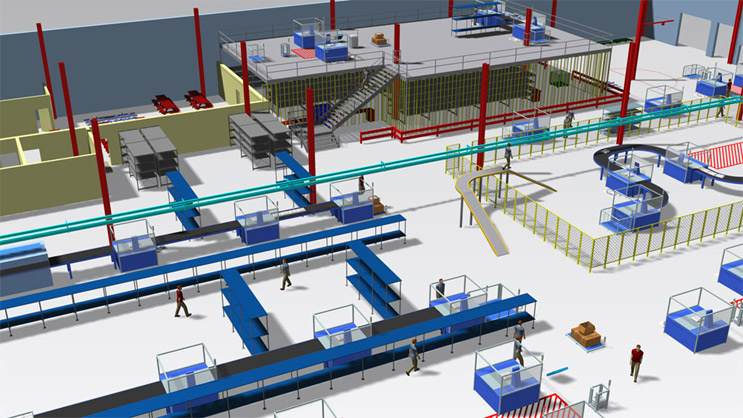
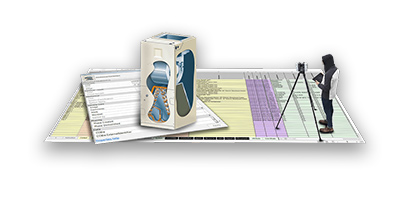
Simulation Modeling
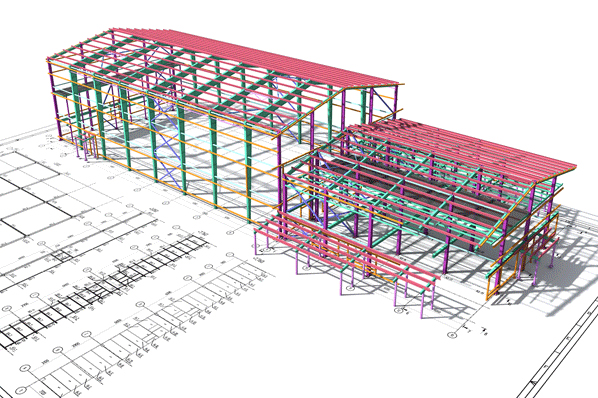
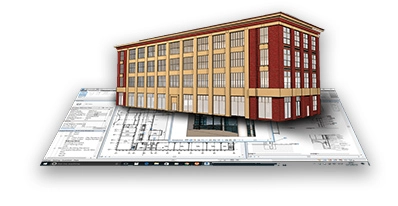
Steel Detailing
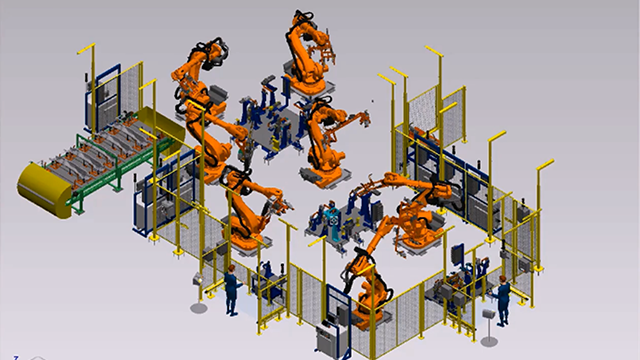
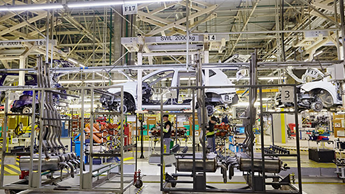
Advanced Manufacturing Engineering

IT & Engineering Staffing
Our People
The PMC team brings together specialists across a wide range of 3D reality capture, engineering, and IT services. Our people deliver exceptional service with fast response time, technical expertise, and long-term client commitment.
Experience You Can Trust
Our full-service, in-house team works together to meet the unique demands of each project. Working side by side, discipline leaders exchange insights to uncover new opportunities for efficiency. This rigorous collaboration enables to deliver the most complex projects.
Innovation in Action
PMC has a rich history of process and technological innovation. Today, we are known not only for skillful execution but also for our ability to build up your team’s technology capabilities. We aim to remain at the forefront of our industry and create ever-smarter solutions that help clients navigate new demands within their field.
What our Clients Say
“With the help of your employees, we were able to make significant strides in obtaining our corporate objectives and often exceeding them in our journey.”
“It is this kind of support that our company needed to help make this project a success and that will keep us coming back to PMI in the future.”
“This is just a quick letter to let you know how personally pleased I am with the results of our recent project.”
“They’ve been with us every step of the design phase, making sure we know how to use the product efficiently and how to get what we need out of the product.”
“By constructing a graphic model, we were able to visualize patient traffic, and determine several operational conditions.”
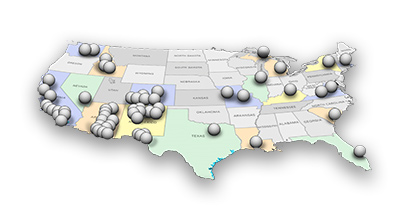
Industry Solutions Across the Globe
Featured Projects
- Date
- October 31, 2023
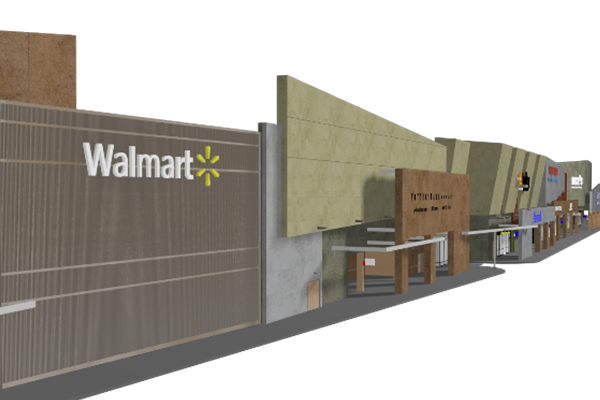
PMC specializes in providing high-volume scanning services for a diverse range of clients, including fast-food chains, fast-casual establishments, cafes, and food markets. Despite the competitive nature of this sector, PMC has secured exclusive contracts for scanning thousands of these locations.
Webinars & Events
Blog Posts

joydeep |
March 12, 2024

joydeep |
February 28, 2024

joydeep |
January 25, 2024
Your Partner in Productivity Improvement
Want to speak with one of our Industrial Engineering, Reality Caputre, or Simulation Experts? Contact us via the form below!
We look forward to helping you achieve your goals.